Post by Evie, Data Science Unit, Welsh Government
Darllenwch y dudalen hon yn Gymraeg
There are many areas of Wales where woodland clearance has taken place, especially since the 19th century. We define ‘lost historic woodland’ as areas of woodland that existed on historic maps but no longer exist today. These areas may be suitable for re-planting because the original soil is well suited for tree growth having an established root network and ecosystem. Finding these areas and targeting them could improve success rates of woodland creation or regeneration schemes and support delivery of key government targets, such as the National Forest for Wales. This blog describes how the Data Science Unit is using computer vision (a type of AI that works with images) to do this.
How can we find where woodland existed?
Clues about where these woodlands might have existed can be found using historic maps that provide valuable insights into how our landscape has changed over time. However, these maps are difficult to use and take a lot of effort to analyse, especially if you are looking across the whole country.
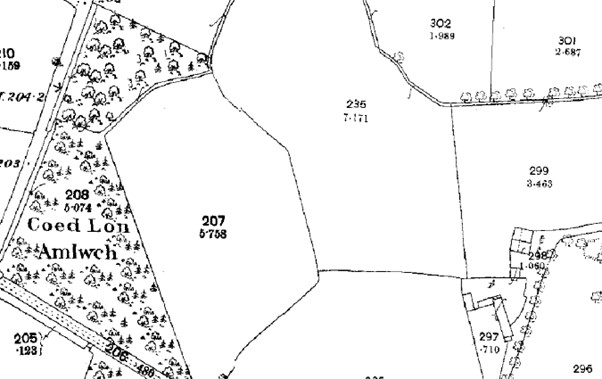
Figure 1: Area of map covered by woodland
The Data Science Unit has been working with colleagues in Cadw (the Welsh Government’s historic environment service), our geography team and Natural Resources Wales to investigate how computer vision models could be used to identify areas of woodland on historic maps. Comparing those areas with recent data may uncover those precious lost woodlands.
How can AI help?
To train the AI model we have used Ordnance Survey maps dating back as far as the 1840s and spent time labelling a few areas on the maps manually using the key as reference. We used open-source geospatial software to draw boundaries around symbols to label different types of woodland. These labels included tree species such as Fir, Orchards, and Osiers.
These labelled maps were used to train an AI model to identify similar areas when shown new parts of the map based on patterns and symbols (features) that it had learnt to recognise.
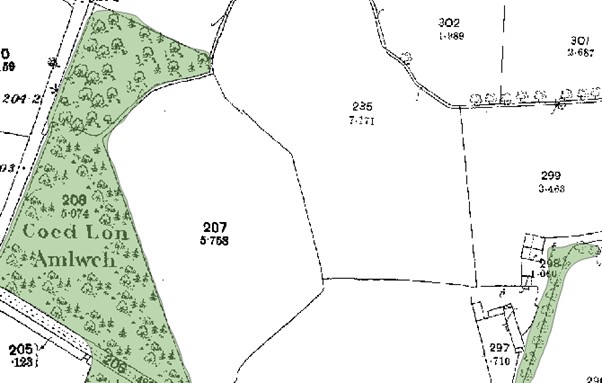
Our first version of the model has shown promising results, as shown in Figure 2. In this example, from an area in Llanerchymedd, Anglesey, the model shaded green the areas where it is confident woodlands are mapped.
Figure 2: AI shaded area of woodland
AI can work well, but is not always correct and further work can improve it
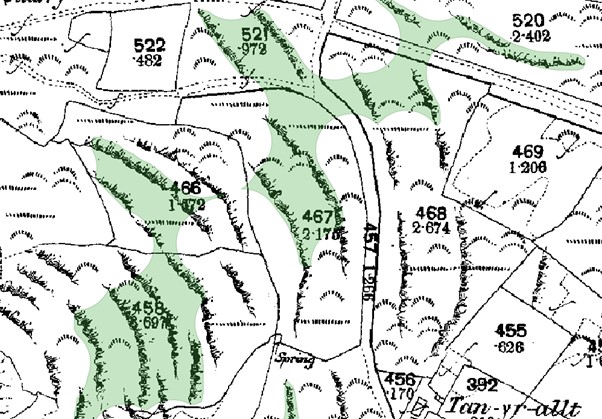
There are places where the AI has labelled an area as woodland, but in fact the map symbols are for quarries, shorelines or contour lines. Also, some text on the map, which was often captured in the training data to name a forest or wood, has also been mislabelled as being an area of woodland by the model. Fortunately, these can be addressed in the next phase of the work.
Figure 3: AI labelling area of map incorrectly as woodland
What’s next?
Our next phase of work will focus on improving the AI model by adding more training data that includes commonly mis-predicted areas, like coastlines, and tuning the parameters of the model. We will also compare the areas of woodland that the model identifies with other data sources, such as the Ancient Woodland Inventory, to identify areas where woodland may have existed in the past, but no longer exist, and therefore have been “lost”. We will be giving regular updates on this work as it progresses.
