Darllenwch y dudalen hon yn Gymraeg
What percentage of over 80s in Wales have been vaccinated against COVID-19? How many 30 to 39 year olds in Wales haven’t received their first dose of COVID-19 vaccination? These and similar questions can be answered in different ways.

The success of the vaccine campaign to date has been well documented, but we know there is still work to be done to ensure as many people as possible are protected. That is why it’s important to understand how vaccination coverage figures are calculated as there are different methods that could be used.
The national headline figures used for vaccination uptake are done on the same basis for the UK and England, Northern Ireland, Scotland and Wales. However the way that age and vulnerable group uptake is calculated can differ between the four nations. This means that caution should be used when looking at these figures and comparing them across the nations. Often the figures won’t be on the same basis and so shouldn’t be compared. In this blog I will explain the approach we take in Wales and the impact this has on the figures.
How are vaccination coverage figures calculated in Wales?
As covered in a previous blog, in Wales we get vaccination data from the Welsh Immunisation System (WIS), a new system developed to manage the delivery of COVID-19 vaccinations. The data in WIS is based on GP records, but it also has the ability to include people who may not be registered with a GP, which is important in improving equitable access to vaccination.
WIS uses GP records because they provide detail at an individual level, so health services know who has and who hasn’t had a vaccine, who they need to invite and who they are expecting for their second jab.
The population figures from WIS are what Public Health Wales (PHW) use to work out the percentage of people that have been vaccinated in different age groups. PHW publish this data daily on the rapid surveillance dashboard. This differs from the approach used for the national-level figures for each UK country which are calculated using Office for National Statistics (ONS) population estimates.
So why do we use GP records from WIS in Wales when looking at age groups or vulnerable groups? There are a number of reasons.
- We’re using the same source for both the number of people that have been vaccinated and the number of people that health boards need to invite for vaccination. This helps target vaccination activity and encourage wider take up.
- Using the GP record data allows us to aggregate the data from an individual or practice level up to larger geographies like local health boards.
- It can be more up to date for older age groups and vulnerable cohorts since they are more likely to regularly interact with NHS services. These groups were the initial focus of the vaccination campaign.
- GP records are continually updated and this feeds through to WIS so it reflects near real time changes in the population.
- This is the standard method used to assess coverage for other child and adult vaccination programmes.
What’s the alternative?
The alternative approach to using GP records from WIS would be to use the ONS population estimates of the number of people in each age group. These are the official estimates of the size of the population, based on the best available data sources. But the ONS stresses that they are estimates, not counts. The ONS gives a great explanation of the strengths and limitations of the estimates.
If we compare data from GP records and ONS estimates, you can see the difference in size of the groups varies, with smaller differences for the older age groups and larger differences for some of the younger groups.
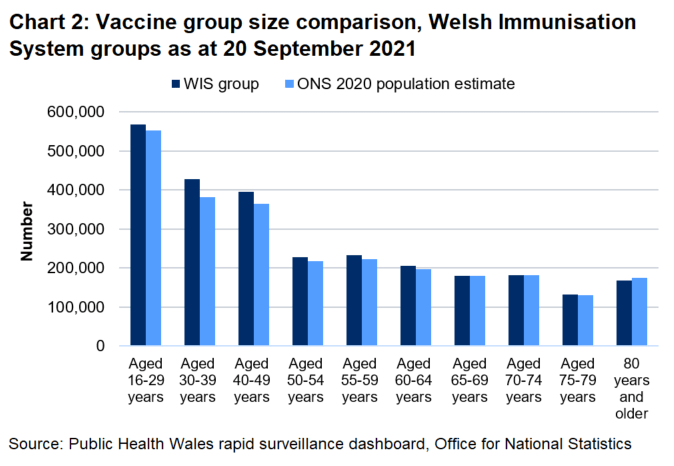
Neither measure is right or wrong, and each approach has its strengths and limitations. For example, GP registers might not accurately capture the number of people in some groups, which can happen more often in younger age groups as people move round for work or study and don’t always register with their new GP straightaway (or deregister from their previous GP). This means that when looking at some age groups, for example 30 to 39 year olds, WIS records likely include more people than are now living in that area.
On the other hand, the latest ONS mid-year estimate population figures are for 2020. These are the first population estimates to include the impacts from the pandemic. However, these estimates refer to the population as at 30 June 2020, meaning that they only account for the first three months of the pandemic, so they might not capture the most recent changes in the population. They are produced by an annual exercise building on the previous year’s figures. This annual process has been building year on year on the figures produced through the 2011 Census, as well as a range of other sources, including GP registers, to account for births, deaths and migration each year. The results of the 2021 Census will be out next year, so we’re now as far away from the 2011 Census as we can be before new census data is available – which will have an impact on population estimates. Further information about the methods used to calculate the mid-year estimates of the population for Wales can be found on the ONS website.
How do the two methods compare?
We can look at how the vaccination coverage figures would change if we used the two different population figures, WIS records and ONS population estimates.
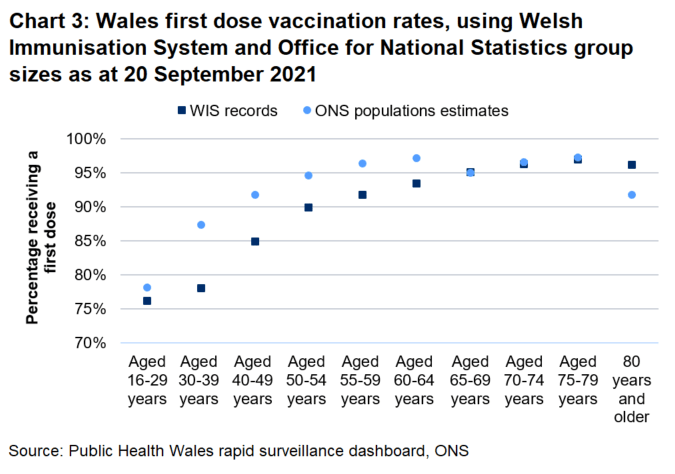
The above chart uses the first dose vaccination rates, and a similar pattern is seen for the second dose percentages. Using ONS estimates would result in a slight reduction in the percentage uptake for certain age groups, including those aged 80+. However, there would be large increases in some of the other cohorts including those aged 30 to 39 and 40 to 49. These differences are likely to be a combined effect of population estimates potentially not reflecting recent changes in the population and NHS registration data being inflated due to individuals not informing their GP when they move away.
The difference in the methods used across the four nations of the UK means that the uptake numbers when looking at age groups aren’t comparable. While acknowledging that neither approach is perfect, the approach used in Wales is better suited to the most vulnerable groups, is updated regularly and also used for measuring coverage of other vaccinations.
Using the groups based on GP records for both age bands and more vulnerable groups, Public Health Wales provide daily updates in the vaccination area of the COVID-19 surveillance dashboard. They also provide Health Board level coverage figures and surveillance reports that include information on equity of coverage between ethnic groups and level of socioeconomic deprivation.
Email kas.covid19@gov.wales
If you want to update your NHS record so you are correctly registered please register with your local GP.
If you need information about accessing the COVID-19 vaccination in Wales, please go to the Welsh Government website.
Stephanie Howarth
Chief Statistician
