Darllenwch y dudalen hon yn Gymraeg
Welcome to the second part of our blog series that introduces some of the projects that the Data Science Unit are working on. Part 1 was published last week.
This blog covers a project that investigates the use of internet speed test data to support our existing knowledge of coverage across Wales.
Ookla Internet speed test data
The availability of robust, fast Internet access is essential for many people and businesses across Wales impacting on local economies. Broadband availability forms an indicator in the Welsh Index of Multiple Deprivation and the Welsh Government have initiatives focussed on bringing fast and reliable internet to the whole of Wales where the market has failed to do so.
During the pandemic, accessing the internet from home has been crucial to many of us following the advice to work and learn from home where possible. Many of our social interactions with friends and family have also moved online during this time.
Internet availability only paints one part of the picture as having a connection does not guarantee quality. We have been exploring Ookla internet speed data to support our understanding of internet access and quality.
Ookla are a major speed test provider and if you’ve run a test at home or on your mobile phone then it is likely that you have used their services. Last year, Ookla started to release global public datasets of their speed test results and encourage organisations and academics to explore the data to see how it can be used.
Updates of the data are published quarterly and there are two different data sets, one for broadband connection and one for mobile internet data. The data is aggregated by square areas roughly 600×600 meters and so offers a considerably localised report on internet speeds and provides several metrics including:
- download speed (average kb per second)
- upload speed (average kb per second)
- latency (milliseconds)
Download and upload speeds are the rates at which files can be transferred from or to the internet. Latency refers to the delay before a requested action is performed. For example, if I click a button on an internet page, how long is the period between clicking the button and the website receiving the signal that I have clicked the button.
The interesting thing about this data is that it gives us some insight in to the internet speeds experienced at a user end rather than the speed expected to be received from internet service providers.
The visualisation below, produced in R (a statistical programming language), shows an example of what this data looks like for the Swansea local authority when layered with the boundaries of the Swansea middle-layer super output areas (MSOA, these are statistical areas around 7,500 people in size).

Each cell is colour coded according to the average download speed reported in the square area. The areas in Swansea that are not colour coded did not have any speed tests conducted within their boundaries. As such, there is no information in the data about them.
For the second visualisation we have calculated a weighted average for each MSOA based on the available metrics to show, by area, the average download speed. This compromises on the resolution of the data but provides a more comparable map for the different MSOAs in Swansea.
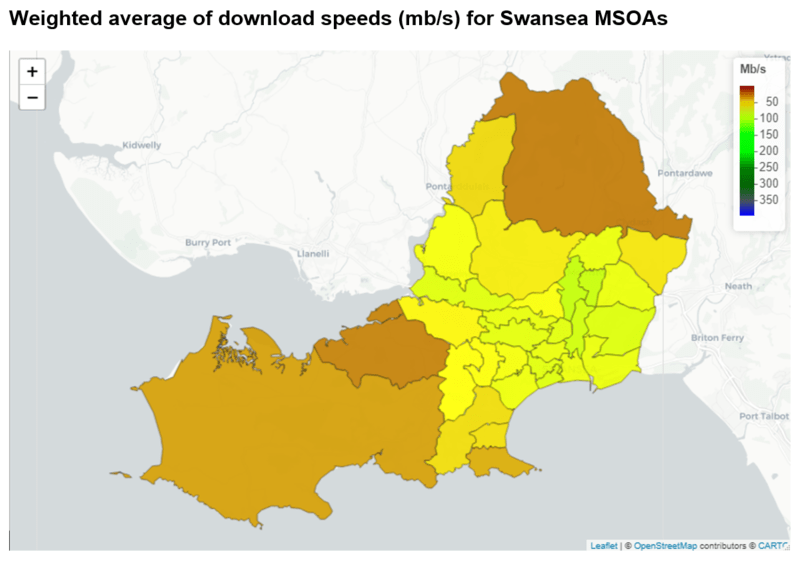
This map enables us to make some basic observations of the data which may happen to be in line with our expectations if we have local knowledge of the Swansea area. For example, the Gower peninsula in the south west, a very rural area of Swansea, has lower average download speeds than the urban centre, located in the south east.
We are just beginning to explore this data and see how this can be used to support Welsh Government and the wider public sector. Capturing meaningful information from the Ookla data is only part of the problem. We also need to be careful about how we interpret what the data represents. The visualisations above show the sparsity of the data in some regions compared to others which will affect the robustness of the information. Social factors too might also influence the data. For example, it may be that more people are likely to run a speed test when they are having issues with their connections possibly causing a bias in the information. While the effect of factors like this are difficult to understand, we need to be mindful of them and explore other datasets that might allow us to validate or estimate any bias in the data.
We have published the code to extract and parse the Welsh data on the data science unit Github website. We will be sharing more about this work in future.
If you want to get in touch with us please email datascienceunit@gov.wales.
Steven Hopkins, Lead Data Scientist
