Darllenwch y dudalen hon yn Cymraeg
On 27 November, we’ll publish the Welsh Index of Multiple Deprivation (WIMD) 2019. This will be a fresh set of ranks of relative deprivation for small areas in Wales.
There’s been a gap of five years since WIMD 2014. That’s five years in which there have been many exciting data developments and advances in techniques that can help us with the complex calculations needed.
In spring, we published a summary of your views on what data we should use to update WIMD. Thanks to the 80+ people and organisations who were involved in the consultation and seminars. We also set out our plans for the last few months of development work for each of the 8 domains of deprivation included in the Index. This blog provides a reminder and an update on those plans ahead of publication of the results.
New data on education and health
In the health domain, we’re adding in new data on obesity among reception age children to strengthen what we know about children’s health and likely future health. We’re still working hard to widen the health issues captured by the Index, by using diagnoses made by GPs for a range of chronic and mental health conditions.
To measure educational deprivation, for the first time we’ll look at outcomes at Foundation Phase, the early stage of statutory schooling up to 7 years old. We’re still working on data to reflect the destination of our 16 year olds; how many are progressing into Further or Higher Education three years on?
Long-awaited improvements to the housing domain
For many iterations of the Index we‘ve been unsatisfied with the quality of data on housing deprivation. This time we have commissioned modelled estimates of poor quality housing across all housing tenures, supplementing a Census indicator on overcrowded housing. These estimate the likelihood of housing in a given area being in disrepair or containing serious hazards (for example, risk of falls or cold housing).
Using new methods
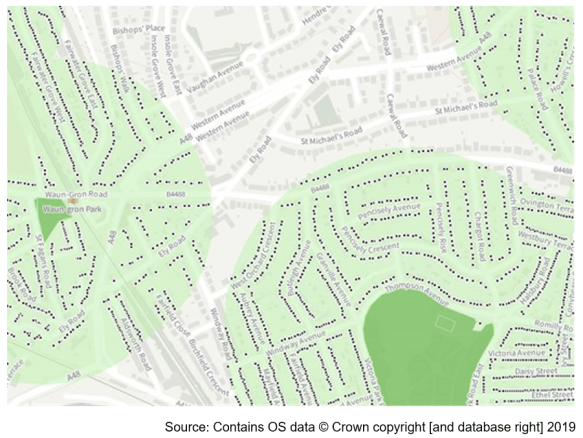
We have been developing a new physical environment sub-domain to measure accessibility, proximity and visibility of natural green space. Ordnance Survey’s Open Greenspace layer has been used in conjunction with Natural Resources Wales’ list of Natural Greenspace sites to estimate the proportion of households in a given area that are within a 5 to 10 minute walk of an accessible natural green space. In addition, we are planning to include an indicator measuring the amount of ambient green space within a given area.
As an illustration, the map below shades in light green the areas within 300 metres of an accessible natural green space, in an area of Cardiff.
Also, to improve our measurement of access to services, we’ve been working with the Data Science Campus at ONS on their new tool to analyse multi-modal transport journeys. The tool, called ’propeR’ and written for the R programming language, will improve the granularity and ease of performing public transport travel time analysis across Wales, and beyond. We’re also bringing in a measure of the availability of fixed line, superfast broadband. This will broaden our access to services domain, previously covering travel times alone, to include online access too.
We’ll be looking more closely at the data with analysts from local authorities in early November. We’re still hopeful that most of these new developments will make it into the Index. This will help us provide an improved and up to date picture of deprivation in Wales.
So what exactly are we publishing?
We now have a full list of what we plan to publish and when, on our website. This will include advance guidance, and presentations that can be shared with others to help us all make better use of WIMD to tackle deprivation in Wales. WIMD is a complex product, and we’re keen to ensure that it is used and interpreted correctly by all users.
Glyn Jones
Chief Statistician
Email: stats.inclusion@gov.wales
