Today we have published 2022-based local authority population and household projections. These are the first set of projections that we have published since 2020.
Darllenwch y dudalen hon yn Gymraeg
Recent population changes
These projections reflect the notable demographic changes we have seen during the last five years, especially for migration.
In recent years, migration flows from outside the UK have increased substantially. The most recent estimates for Wales suggest that net international migration, which is the difference between the number of people moving in and out of Wales from outside the UK, is almost five times higher than it had been on average in the previous decade. Provisional estimates from the Office for National Statistics (ONS), however, suggest that long-term international migration is now showing signs of decreasing (ONS).
Migration flows between Wales and the rest of the UK have been fluctuating. In recent years, net internal migration, that is, the difference between the number of people moving in and out of Wales to the rest of the UK, is estimated to be over one and a half times higher than it had been on average in the previous decade. However, this figure has been fluctuating substantially year on year.
We also continue to see a declining number of births, with a total fertility rate of 1.35 in in 2024, the lowest on record.
What you need to know about the projections
Population projections are not forecasts. What we mean by that is that they are calculated based on assumptions about latest trends in fertility, mortality and migration, and those assumptions are inherently uncertain.
We have made some changes to the methods used to calculate our projections because of these latest demographic trends. Because long-term international migration is estimated to have been substantially higher between mid-2022 and mid-2024 than in previous years, we have made sure that projected levels of international migration are broadly in line with the published estimates during this period.
We have also changed our methods for the household projections to ensure that they are consistent with our household estimates, incorporating the latest data about household composition from Census 2021.
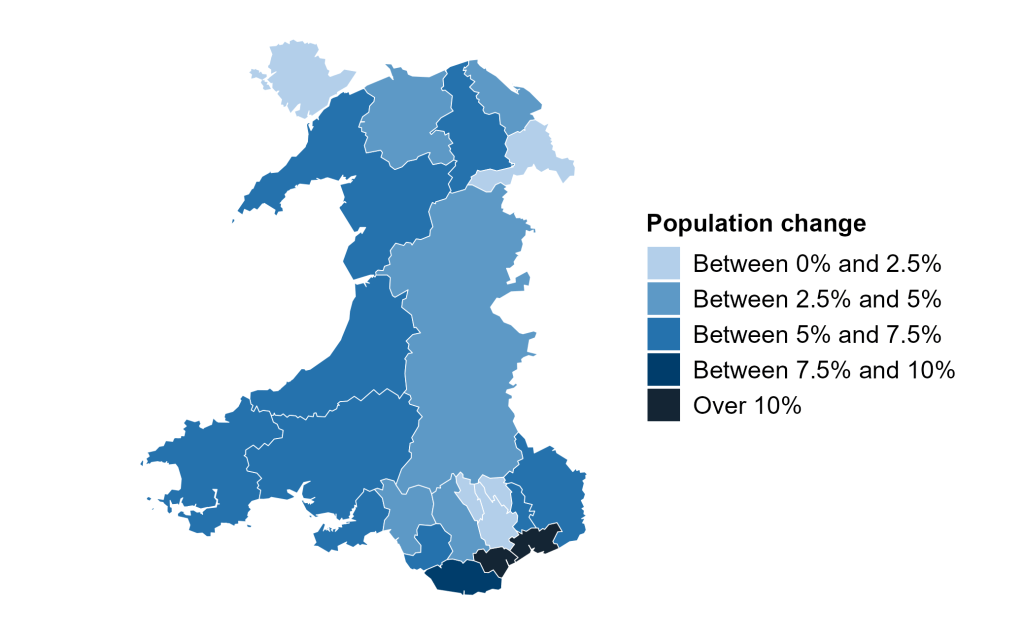
The changing demographic trends we have seen recently therefore mean that the latest projections are different to the previous projections. The population is now projected to increase in all 22 local authorities between mid-2022 and mid-2032, with the largest increases projected to be in Cardiff and the neighbouring local authorities Newport and the Vale of Glamorgan. We see similar patterns in the household projections.
In the previous projections, the population was projected to decrease in four local authorities during the first 10 years of the projection period.
Figure 1: percentage population change between mid-2022 and mid-2032, by local authority
Advice on the use of the projections
The map above is based on the principal population projections, which best reflect the latest fertility, mortality and migration trends.
We also publish alternative, or ‘variant’, projections alongside this main projection. They are based on alternative future scenarios of fertility, mortality and migration compared with the principal projection. They provide an indication of uncertainty, but do not represent upper or lower limits of future demographic behaviour.
The 10-year average migration projection, for example, considers a longer 10-year time series of migration data, rather than the 5 years used in our main projection. This projection is generally lower than our main projection as it includes periods when levels of migration were lower than they have been recently.
The same is true for the alternative projection that is based on 15 years of migration data. However, one limitation of these alternative projections is that they risk dampening the effect of more systemic changes in migration that have occurred recently, especially if recent migration trends will continue into the future.
Users should consider the full range of variants when using the projections, to reflect the uncertainty in current and future migration patterns.
We would also continue to advise our users to use the most recent mid-year estimates of the population for all years where they are available, as population projections may differ from published population estimates in both the short- and long-term.
To summarise, do use:
- the principal projections to inform planning and decision-making, as they are based on the latest trends in fertility, mortality and migration
- the full range of alternative projections to understand the range of possible future scenarios and to reflect uncertainty in your analysis
- the most recent mid-year population estimates for any years where they are available, as these are the best possible estimate of the size of the population
Do not:
- treat the alternative projections as strict upper or lower limits. These are not forecasts of what will definitely happen
- ignore the uncertainty inherent in population projections. Always consider a range of scenarios before making decisions
- add up the local authority population projections if you are interested in population projections for Wales. Instead, use the ONS’s 2022-based national population projections (ONS)
Next steps
Now that we have published population and household projections for local authorities, we will be publishing projections for national parks next.
We would like to thank the Wales Subnational Projections group for their input and advice during the production process of these projections, as well as our local authority colleagues who participated in the quality assurance process.
Please do get in touch with the team at stats.popcensus@gov.wales if you have any questions about these projections.
Stephanie Howarth
Chief Statistician
